
Here’s our fantasy premier league managers article where we give an analysis of the FFGeek contributors seasons
fantasy premier league managers – an analysis of the FFGeek contributors seasons
Here we look at various ways of analysing the contributors season in a similar way to what we did with the 10 top FPL managers we follow.
The analysis will only include those managers who regularly showed their FPL team in the FFGeek contributors show their teams articles.
The analysis is mainly done through the excellent website FPL statistico
Firstly here’s the final contributors table. Congratulations again to Yaniv for winning the league. In the end it was comfortable by 42 points

A table of basic stats
You can take a copy of this google spreadsheet
Using that link you can also see the gameweek history of each manager as well as a line graph showing every managers week by week overall rank.
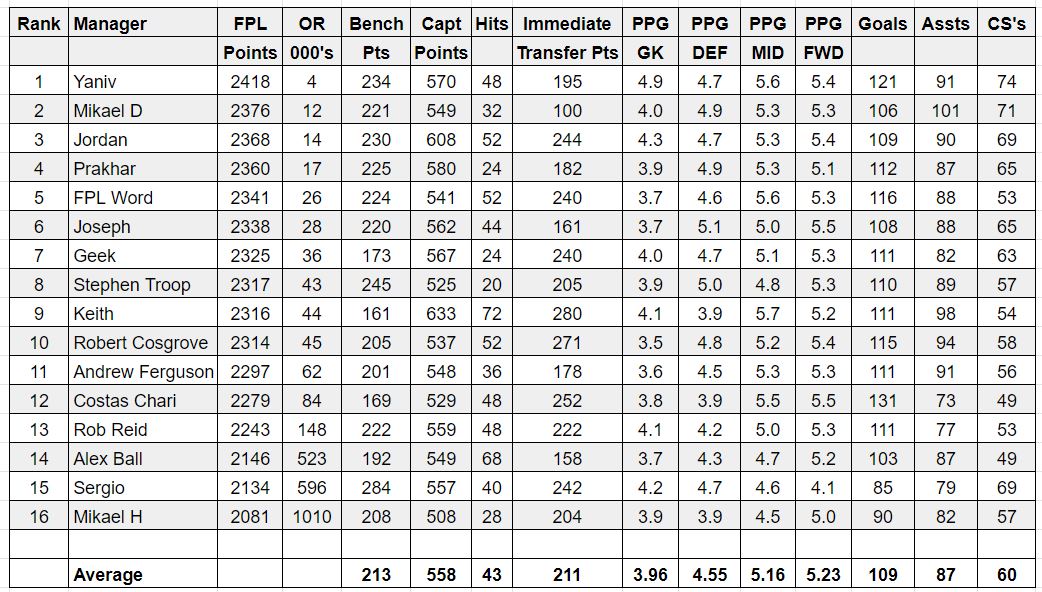
While only Yaniv finished in the top 10k, 11 of the 16 managers finished in the top 1% of the 6.3 million teams.
What does it mean?
I talk about the individual stats in the 10 top FPL managers review article. That article showed a reasonable relationship between the managers who took less hits and obtained a high number of clean sheets and overall rank. However the same cant be said for the relationship with the contributors.
While the stats were interesting. No stat seemed to be the key to overall rank success.
Yaniv
However if you look at Yaniv’s ranks he was 4th in captain points. Top in GK points PPG, 5th equal in Defs, 2nd equal in Mids and 3rd in Fwds PPG. Top in goals, 4th equal in assists and 1st in clean sheets. He was 11th in immediate points from a transfer but obviously he made the points up afterwards.
My ranks
My ranks pretty much reflected my position of 7th with a couple of exceptions. I was 6th in immediate transfer points, GK PPG, Goals and 7th Clean sheets. I was 5th equal in Defs PPG and 6th in Fwds PPG. My low rankings were 10th in midfield PPG and 12th in assists.
The contributors 5 most successful players and 5 worst performers
There’s a 2nd google spreadsheet which shows each managers top 5 and bottom 5 performers. The players had to be in the managers FPL team at least 5 times. It also shows the amount of times they were in the team and the average points gained. That is turned into total points and shown as a % of their total FPL point score.
Here’s a summary which shows how many times a player appeared in the contributors top 5 best performing players
| Player | Times in top 5 |
| Mane | 15 |
| Aguero | 11 |
| Hazard | 11 |
| Kane | 9 |
| Salah | 8 |
| Alexander Arnold | 5 |
| Laporte | 4 |
| Robertson | 3 |
| Vardy | 3 |
| Aubameyang | 2 |
| Rashford | 1 |
| Fraser | 1 |
| Rondon | 1 |
| Wilson | 1 |
| Pogba | 1 |
| Milivojevic | 1 |
| Van Dijk | 1 |
| Rashford | 1 |
| Sterling | 1 |
Here’s a list which shows how many times a player appeared in the contributors top 5 best performing players. Minimum of in 2 lists otherwise it would be too long
| Player | Times in bottom 5 |
| Digne | 5 |
| Son | 4 |
| Pereira | 4 |
| Wan Bissaka | 4 |
| Ings | 4 |
| Arnautovic | 4 |
| Patricio | 3 |
| Pogba | 3 |
| Bednarek | 3 |
| Walcott | 3 |
| Balbuena | 2 |
| Kolasinac | 2 |
| Rashford | 2 |
| Diop | 2 |
| Shaw | 2 |
| Foster | 2 |
| Murphy | 2 |
| Doherty | 2 |
| Bennett | 2 |
Here’s a summary table which shows the FPL managers summary stats for the best and worst 5 performing players showing averages for the amount of times they were in the team, the averaged points gained and the total points. There’s each managers individual top 5 and bottom 5 in this 2nd google spreadsheet
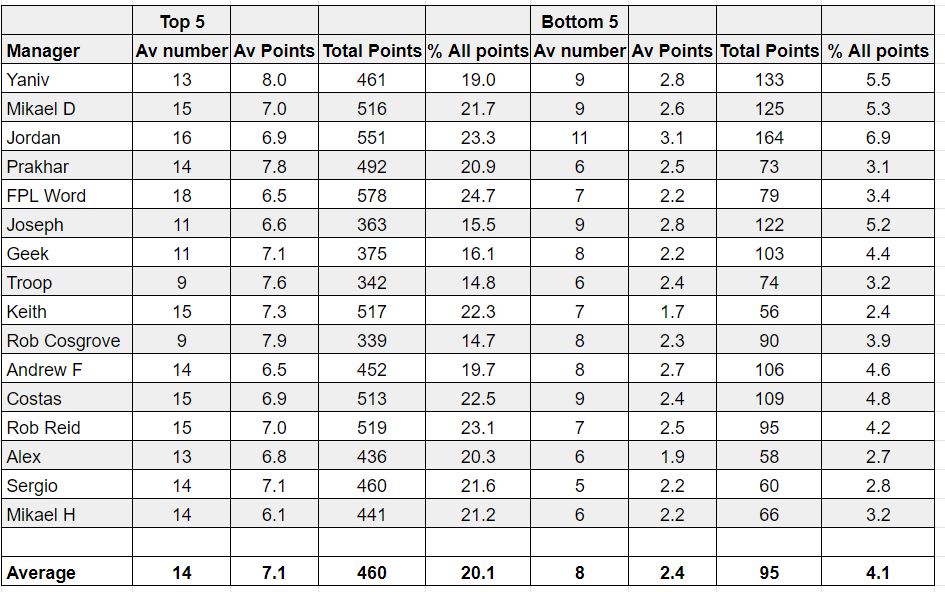
Unfortunately there was no stat which showed a strong relationship with overall rank. You can see though that Yaniv was 1st and 2nd in the 2 average points categories.
That’s it hope you found it interesting even if it didn’t unearth any silver bullets
Follow FFGeek on twitter and facebook and instagram for article updates and news


